|
|
You are here: Foswiki>ELabs Web>FGCSSPCFPFGCS2013SI>ExecutionChoices (2019-05-22, AdminUser)Edit Attach
Background for students on choices for execution control.
How to choose how and where your analysis is executed
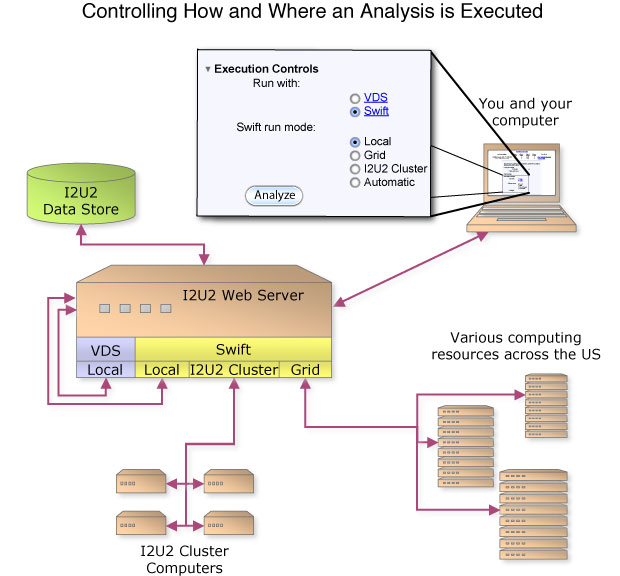
When running an analysis, you get to choose how and where the analysis is run.How:
There are two systems to express, execute and track results of analysis workflows. VDS – the GriPhyN Virtual Data System that uses the Virtual Data Language to describe workflows. SWIFT- the successor to VDS that uses Swiftscript to describe workflows.Where:
VDS currently runs the analysis on the local machine. It provides the fastest results if there is only one analysis running. SWIFT can run in three places:- Local machine,
- ELabs cluster,
- Grid (initially the Teraport cluster at the Computation Institute, University of Chicago)
This diagram shows the choices you will see on your computer screen and the configuration of the computers you can access.
This table summarizes the features of the different choices you can make. The term "job" means an analysis you have submitted.
How |
Where |
Speed |
Reliability |
Pros |
Cons |
Best For |
VDS |
Local |
Fast |
High |
Immediate results for short jobs |
Ties up the CPU and slows down other local analyses |
Fast jobs involving small datasets |
Swift |
Local |
Fast |
High |
Immediate results for short jobs |
Ties up the CPU and slows down other local analyses |
Fast jobs involving small datasets |
|
i2u2 cluster |
Half as fast as local |
Still in testing |
Larger analyses can be run without affecting local analyses |
Slower; still being tested |
Intermediate size jobs with medium data sets |
|
Grid |
Slow |
Least reliable |
Ability to run large CPU and data intensive jobs |
Slowest and sometimes unreliable |
CPU-intensive jobs with large datasets |
Screens Encountered After Submitting a Job to i2u2 Cluster or the Grid.
You can watch the progress and queue an analysis so you can go work on something else. You will see the following on your screen once you have started the analysis: * Screen after a job is submitted: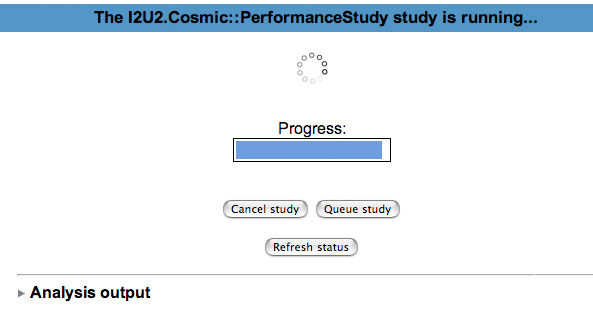 Later you can click on the Analysis submenu on the Data Menu and see a list showing how your submitted analyses are doing and click on the results when they are done:
* Analysis List:
Later you can click on the Analysis submenu on the Data Menu and see a list showing how your submitted analyses are doing and click on the results when they are done:
* Analysis List: 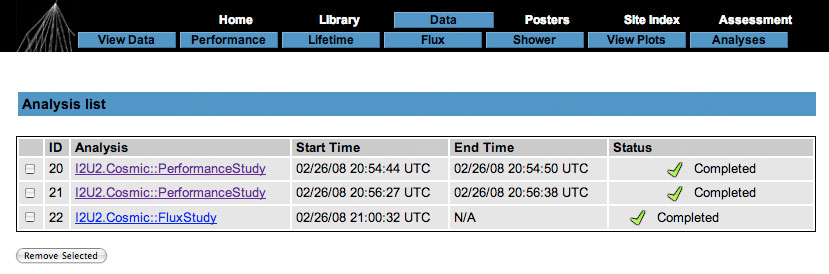 The submitted analyses only stay on this queue for a set period of time, so it is important to get your results and save them as plots if you want to keep them.
-- Main.LizQuigg - 26 Feb 2008
The submitted analyses only stay on this queue for a set period of time, so it is important to get your results and save them as plots if you want to keep them.
-- Main.LizQuigg - 26 Feb 2008 

| I |
Attachment | Action | Size | Date | Who | Comment |
|---|---|---|---|---|---|---|
| |
analysis_list.jpg | manage | 51 K | 2008-02-26 - 23:52 | Main.UnknownUser | Analysis List |
| |
i2u2_execution.jpg | manage | 56 K | 2008-02-26 - 23:29 | Main.UnknownUser | Controlling How and Where an Analysis is Executed |
| |
in-progress.jpg | manage | 19 K | 2008-02-26 - 23:51 | Main.UnknownUser | Screen after a job is submitted |
Edit | Attach | Print version | History: r44 < r43 < r42 < r41 | Backlinks | View wiki text | Edit wiki text | More topic actions
Topic revision: r44 - 2019-05-22, AdminUser
Ideas, requests, problems regarding Foswiki? Send feedback